The fundamental of trading is survival, followed by profit. Therefore, before each operation, you should first think clearly whether your operation is reasonable and whether the principal is safe. You should form a set of trading ideas that belong to you and continuously optimize and improve them. Although the advice of the academicians in the crypto cannot make you rich overnight, it can always help you. Only those who survive in the crypto for a long time and persevere to the end can get the results they want. I hope you understand.
Don't forget, the darkest hour is often the hour before dawn. You are never alone in the pursuit of your dreams. You still have me.
I am an academician in the crypto and a warrior who has always been protecting the leeks. I wish my fans to achieve financial freedom in 2025. Come on together!
Crypto(BTC) Latest Market Analysis
The current price of Bitcoin is 115000. It is 1:30 am Beijing time now. The highest daily K-line is 117030. It has fallen back from the high to the EMA trend indicator. Pay attention to the 0.786 support level of 114000 and the overlap of the EMA60 trend line. In addition, the K-line fell below the middle track of the Bollinger Band at 116700. The support turned into pressure. The overall trend of the intraday market can be basically determined. It is in the sideways repair stage. The four-hour K-line is currently at the intersection of EMA15 and 30 at 115000. MACD is continuously The price fell from the upper track of 117100 to the middle track of 114300 and traded sideways. The short-term support is obviously in the range of 115000 to 114500. As long as it can't go down, the market will trade sideways at a high level. If it fails, it can go south. The main force will probably form a Double Botto structure at 112000. After taking profits at 112000, you can consider going north to test the position. At the current position, the risks of both long and short positions are greater than the benefits. Consider it when it reaches the key position.
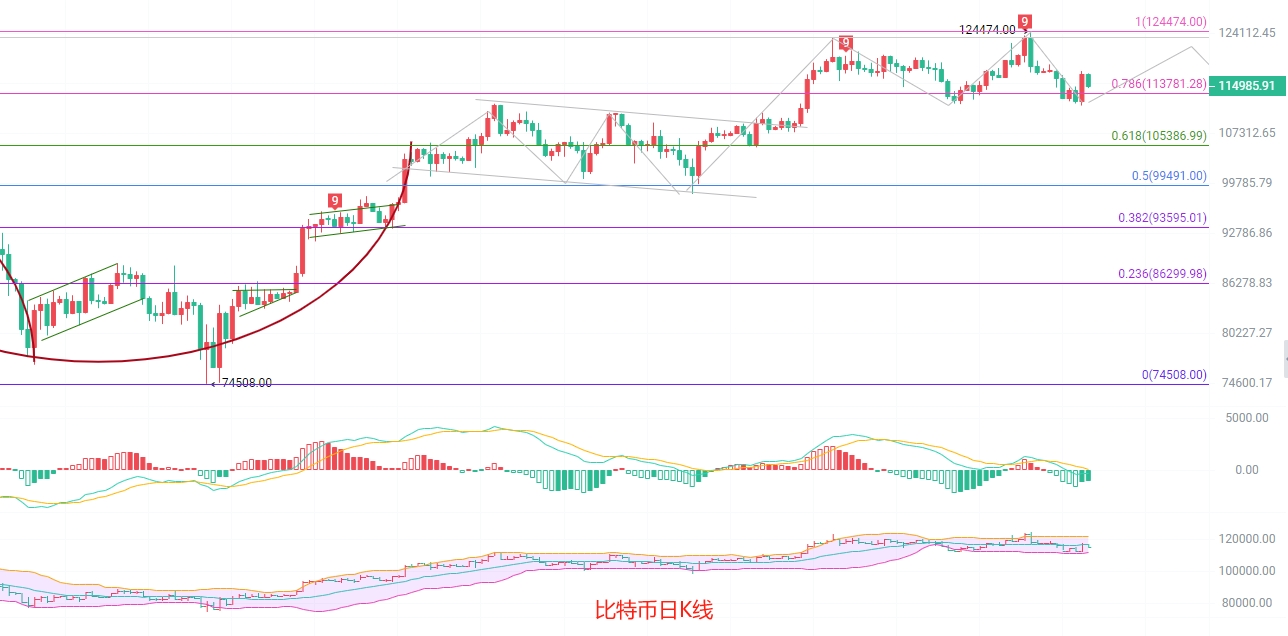
Short-term reference: small losses and big profits are the goal
If the price falls below 115000 to 114500, it will move south. Stop loss 500 points, target 114000 to 113500, break 113000 to 112500.
The resistance level below is 112000 to 111500, with a stop loss of 500 points. The target is 113000 to 113500. If it breaks, it will be 114000 to 114500.
Crypto Academician: Ethereum (ETH) Latest Market Analysis Reference
The current price of Ethereum is 4750. It is now 1:30 am Beijing time. The daily K-line high of Ethereum was 4830. After yesterday's record high of 4888, it rushed to the hot spot. The current fluctuations are basically above 200 points, especially under the current bullish trend. The main force is clearing back and forth. The greater the force, the greater the strength of the stretch. As a trader, I personally recommend keeping the chips in your hand first and survive first. Don't open a position casually. The strength of the daily K-line retracement is not enough. The MACD golden cross has not turned back. The strong bulls still exist. The four-hour K-line has formed an ascending pennant pattern at a high level. The triangle support focuses on 4660. The MACD top divergence is formed. The main force is likely to have another wave of highs and then a sharp drop. You can wait for the next wave of stretching to test the south. The upper rail pressure of the Bollinger band has come to 4920. The short-term support focuses on 4600. Intraday short-term recommendations are mainly high short-selling and quick entry and exit. Friends who like to follow the trend suggest waiting and waiting for subsequent article updates for reference.
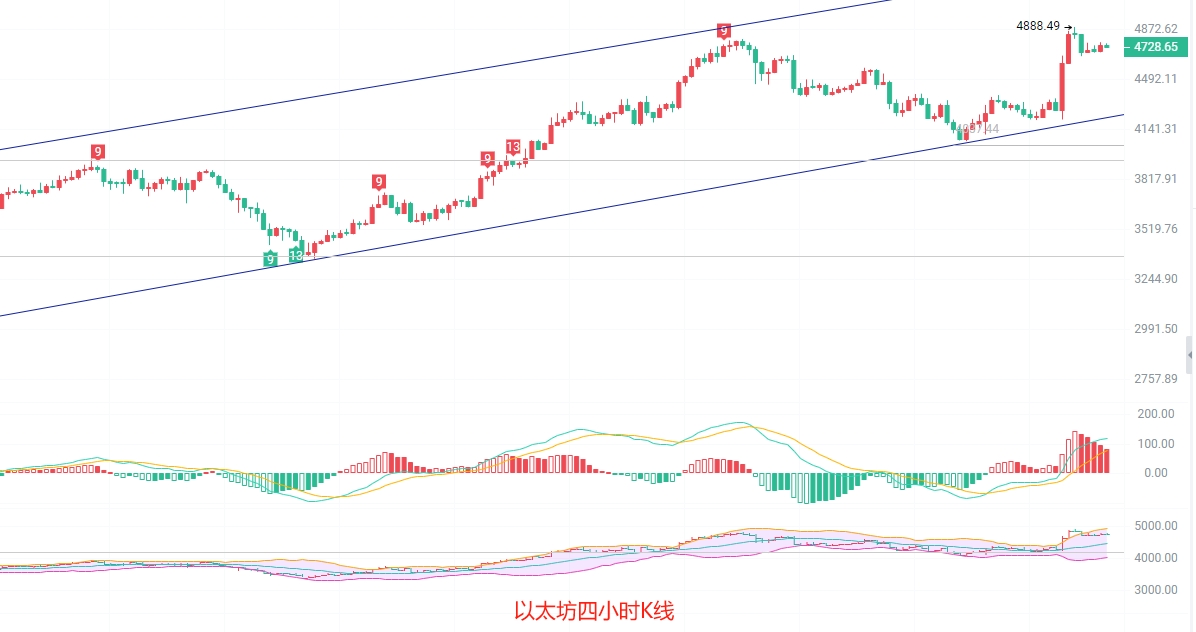
Short-term reference: Always set a stop loss and put safety first
Go south to test the position at 4800 to 4850, defend at 4900, stop loss 40 points, target at 4750 to 4700, break at 4650
Northbound test position 4650 to 4600, defense 4550, stop loss 40 points, target 4700 to 4750, break to 4800
The specific operation is based on the real-time data of the market. For more information details, please contact the author. There is a delay in the release of the article. The suggestions are for reference only and the risks are borne by the user.
This article is exclusively contributed by a Crypto Academician and represents solely his views. He has conducted in-depth research on BTC, ETH, DOGE, DOT, FIL, EOS, and other platforms. Due to the time it takes to publish this article, the views and suggestions above are not current and are for reference only. Reprint at your own risk. Please credit the source. Maintain a reasonable position when placing trades and avoid overweight or full positions. The Academician also hopes that all investors understand that the market is always right. If you are wrong, you should analyze your own mistakes and avoid letting profits that should have been earned slip away. There's no need to be smarter than the market when investing. When a trend emerges, respond and follow it; when there's no trend, observe and remain calm. It's never too late to act until the trend finally becomes clear. Tomorrow's success stems from today's choices. Heaven rewards hard work, earth rewards kindness, humanity rewards sincerity, business rewards trust, industry rewards excellence, and art rewards dedication. Gains and losses are unnoticed. Cultivate the habit of strictly setting stop-loss and take-profit rules for every trade. The Crypto Academician wishes you happy investing!